Stock Market Repeating the Sideways 70s
Free Chart In Focus email
Delivered to you every week
There is an important 40-year cycle that operates in the financial markets, and it also shows up in other areas such as real estate booms, gold rushes, and economic wars. To help us see how this 40-year cycle affects the stock market, this week's chart looks at the DJIA now versus 40 years ago.
The current market pattern is shown in blue, while that of 40 years earlier is shown in black. By aligning these two patterns this way, this chart equates the 1942 market bottom with the 1982 bottom. In raw price terms, the growth in the DJIA was greater during the 1980s and 1990s than it was in the 1940s and 1950s. But when we adjust the DJIA's value to look at "total return" (assuming that dividends were reinvested), we see that there is an amazing similarity.
Prior to the 1980s, and the deregulation of the brokerage industry, stocks were typically owned by investors for the purpose of collecting dividends. So the dividend payouts decades ago were much higher as a percentage of earnings than they are now. For a number of reasons (including tax law changes and transaction costs), companies and investors now tend to gravitate more toward capital gains than was previously the case. So money that once would have been paid out as dividends is used now for share repurchases and capital improvements. That is why adding in the dividends paid by DJIA component stocks brings the earlier total return plot up to be equal to the current one.
What this overlay shows, in plain terms, is that the progress in the DJIA since the 1982 bottom is nearly identical to its progress at a similar point 28 years after the 1942 bottom. During the secular bull market years of the 1980s and 1990s, the general slope of the advance matched that of the 1940s and 1950s, and now the sideways movement is proceeding roughly according to the script.
One reason why this is important is that from examining this relationship, we can equate the decade of the 2010s to that of the 1970s, when stock prices moved generally sideways. By the end of that decade, no one was discussing the advantages of "buy and hold", nor "dollar cost averaging". The keys to investing success back in the 1970s were in finding the hot new stock or sector, and also in identifying the right time to be in or out of the market.
Those themes are going to again be important in this decade. That is why learning to understand market timing is more important now than it was 20 years ago. And by around 2022, it will be time to switch back to buy and hold investing, just as it will have gone completely out of fashion.
Tom McClellan
Editor, The McClellan Market Report
Feb 12, 2010 Birth Rate and the Stock Market |
Dec 18, 2009 Drop in inflation should bring DROP in crime |
Jul 17, 2009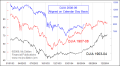 Panics We Have Seen Before |
Nov 06, 2009 Civilian Employment Level (Follow Up) |