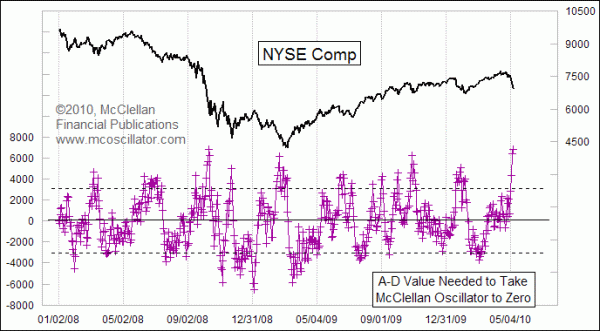
What It Takes To Get The Oscillator To Zero

Free Chart In Focus email
Delivered to you every week
On our Market Breadth Data page, we provide a variety of numbers each day related to the calculation of the McClellan Oscillator. One of those is the Advance-Decline (A-D) difference that would be required tomorrow in order to get the McClellan Oscillator back to zero.
This can be a useful number to know for people who like to keep an eye on the Oscillator, and whether it is positive or negative. Knowing this number can allow an analyst to look at the A-D difference throughout the day and know whether it will result in a positive or negative McClellan Oscillator at the end of the day.
This number can also be useful in another way. When it gets to an extreme positive or negative value, it shows an extended condition for the market. This is the condition we see at the moment, in the wake of the stock market's big decline this week on Greek debt worries and the "trading glitch" that sent the DJIA down briefly below 10000.
To briefly review the math, the formula for the McClellan Oscillator is as follows:
McOsc = 10% Trend - 5% Trend (of the daily A-D difference)
What we call the 10% and 5% Trends are exponential moving averages with those percentages as the "smoothing constants". Some analysts use the more modern fashion of referring to them as a 19-day and 39-day EMAs, but we prefer the original terminology coined by P.N. Haurlan in the 1960s when he was the first person to employ EMAs for computerized analysis of stock price movements. See Sherman's description and the accompanying booklet.
The formula for the 10% Trend is:
10%Ttoday = 0.10 x (A-D) + 0.90 x 10%Tyesterday
The 5% Trend formula is the same, except that the constants are 0.05 and 0.95. One can then use those formulas in the McClellan Oscillator formula to find that the McClellan Oscillator depends on today's A-D difference and yesterday's values for the 10% Trend and 5% Trend. I'll save you the full algebraic derivation, but one can reduce the equation for the A-D difference to produce a zero reading on the McClellan Oscillator down to the following:
(A-D)osctozero = 19 x 5%T - 18 x 10%T
The reading for Friday May 7 is +6866. That is more than twice as many issues as there are listed on the NYSE. In other words, no matter what the market does on the next trading day, it is mathematically impossible to get the Oscillator all the way back up to zero in one day.
But the interesting point about instances of such large values is that they only arrive at market extremes. The dashed horizontal lines are set at +/-3000, which is approximately the number of issues traded these days on the NYSE. Readings outside those thresholds are pretty rare, and so they show that something different is going on in the market when they do appear.
It is also worth noting that the extreme high values do not coincide with the final price low. They tend to arrive a few days ahead of the final price low, and so seeing a new extreme high value is a sign that the market is close to an important bottom, but not quite there yet.
Tom McClellan
Editor, The McClellan Market Report
Nov 20, 2009
NDX A-D Oscillator |
Oct 30, 2009
A-D Line Back Near All-Time Highs |
Oct 16, 2009
A-D Line Has the Story on Corporate Profits |
Jun 18, 2010 All Time Record Low McClellan Oscillator |
Jul 16, 2010 Start Point for Summation Index Does Not Matter |