HY Bond A-D Line Rehabilitates a Divergence

Free Chart In Focus email
Delivered to you every week
I like to say that a divergence is a "condition", and not a "signal". This is an important distinction which sometimes confuses people, so I will elaborate.
A "signal" in chartist terms is something with a precise moment of indication, like seeing a price cross through a moving average, or seeing a Price Oscillator reverse direction. A signal is therefore testable, if one were testing an automated trading system.
A "condition" is something which exists on a chart, but which does not have that precise timing aspect. A condition like being overbought, or like a divergence versus prices, can persist for a while before it matters. That makes it something which is not well suited to system testing, because one has to decide the moment that such a condition mattered to make that hypothetical trade. And a condition like a divergence can also get resolved. The word I like to use is "rehabilitated".
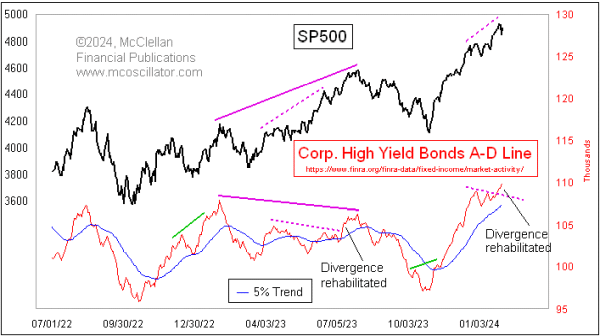
That is what we are seeing now in this week's chart. The daily Advance-Decline line for corporate high yield bonds behaves like the stock market most of the time. But it can show us problems early, when it starts behaving differently from prices. In early January 2024, this A-D Line stopped confirming the higher highs that we were seeing in the SP500 Index. That was a concern for a while, but the resurgent market strength in late January 2024 pushed this A-D Line up to make a higher high, so there was no longer a divergence versus prices.
This week's chart shows a prior example of a rehabilitated divergence which unfolded back in July 2023. The SP500 then was making higher highs, but this High Yield Bond A-D Line was making divergent lower highs, signaling that there was trouble in the liquidity stream which feeds both the stock market and the high yield bond market. That trouble then got resolved in mid-July 2023, when this A-D Line moved to a locally higher high, thus rehabilitating the small divergence highlighted by the dashed divergence line.
There was still the problem then of a larger divergence (the solid line), which ended up mattering and told us that there were liquidity problems that manifested themselves in the August to October 2023 stock market decline.
This is one other attribute of divergences. They don't tell you when they are going to decide to matter, and they can also sometimes be hard to read in real time as they are happening. Six months later they are much easier to read, but we don't get to trade that way.
The current higher high we are seeing in the HY Bond A-D Line is bullish news for the stock market for now. If we are going to end up seeing weakness in stock prices later this year (and I see strong indications of that in my long term models), then I would expect to see hints of those problems show up in advance in this HY Bond A-D Line. But those problems are not evident yet.
Tom McClellan
Editor, The McClellan Market Report
Dec 21, 2023
Plenty of Strength in HY Bond A-D Line |
Oct 27, 2023
McClellan Oscillator Bullish Divergence |
May 11, 2023
NYSE A-D Line Adds to the List of Divergences |