Uranium Blowoff Being Echoed by Gold

Free Chart In Focus email
Delivered to you every week
I write frequently about how a lot of commodities prices and even interest rates tend to echo the movements of gold after a lag time. So naturally the question becomes, "What leads gold?"
I don't have a perfect answer, just a pretty good one. And that answer is uranium. I happened upon this relationship back in 2015, when I first found the data for uranium prices at https://www.cameco.com/invest/markets/uranium-price. You can also get updates on it daily at https://tradingeconomics.com/commodity/uranium.
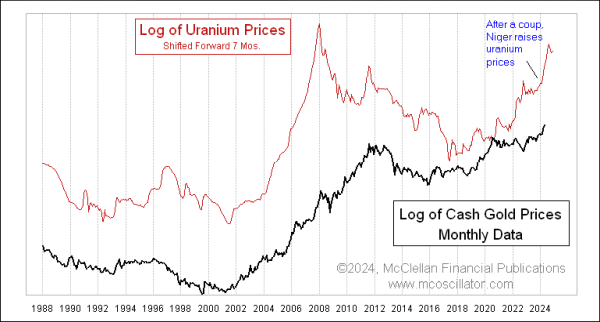
What I noticed when first looking at the data on uranium prices was that the plot looked a lot like that of gold prices, so I put the two together. That then led me to see that the movements in uranium prices tended to lead gold, and so after some tinkering I found that a 7-month time offset made for a much better correlation between the two plots. And that is what is featured in this week's chart.
It is not a perfect relationship, especially in terms of the magnitudes of gold's movements not matching those of uranium prices. But the timing of the turns does match up pretty well.
Gold just recently jumped up to new all-time high levels, matching a move upward months ago by uranium. Part of that surge in uranium prices was tied to a coup d' etat in Niger, but it still seems to have been echoed by gold.
Uranium prices peaked at $100.25 per pound back in January 2024. If we add 7 months to that, we get the month of August 2024 as the 7-month echo point for gold prices, assuming things work perfectly with the normal 7-month lag. But things do not always work out perfectly, and we are pretty close to that 7-month point now.
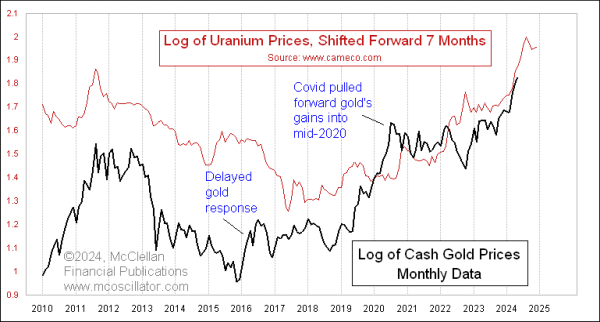
Here is a zoomed in chart so we can see the finer details:

At this level of resolution, we can see that the correlation is interesting, and sometimes really good. But it is far from perfect, and so expecting that one can time the gold market perfectly using uranium prices is expecting too much from this relationship.
With that in mind, the sideways movement of uranium prices since the January 2024 peak suggests that gold prices should also see some "not up" movement later this year. I wish I could pull a more precise expectation for gold out of this relationship, but it is just a little bit too squishy to pin down tighter than that.
Tom McClellan
Editor, The McClellan Market Report
May 28, 2015
Uranium and Gold, a Peculiar Correlation |
Jun 04, 2015
Uranium and Gold, Part II |
May 09, 2024
Gold Shows an Oil Price Bottom Ahead |